Contents
Ejercicio 1
t=linspace(0,1);
b0=bernstein(3,0,t);
b1=bernstein(3,1,t);
b2=bernstein(3,2,t);
b3=bernstein(3,3,t);
plot(t,[b0;b1;b2;b3]);
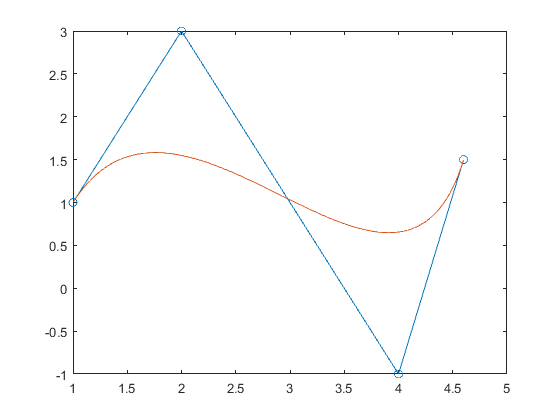
Vx=[1, 2, 4, 4.6 ];
Vy=[1, 3, -1, 1.5];
n=length(Vx)-1;
t=linspace(0,1);
Qx=0;
Qy=0;
for i=[0:n]
Qx=Qx+Vx(i+1).*bernstein(n,i,t);
Qy=Qy+Vy(i+1).*bernstein(n,i,t);
end
plot(Vx,Vy,'o-',Qx,Qy)
Ejercicio 2
velocidades=xlsread('sotaventogaliciaanual.xlsx');
histogram(velocidades)
xlim([0 25])
pot=xlsread('sotavento_curva potencia.xlsx');
t=linspace(0,25);
y=pchip(pot(:,1)',pot(:,2)',t);
plot(pot(:,1)',pot(:,2)','.',t,y)
velocidad=xlsread('sotaventogaliciaanual.xlsx');
if any(isnan(velocidad))
x=1:length(velocidad);
i=find(~isnan(velocidad));
velocidad=interp1(x(i),velocidad(i),x);
end
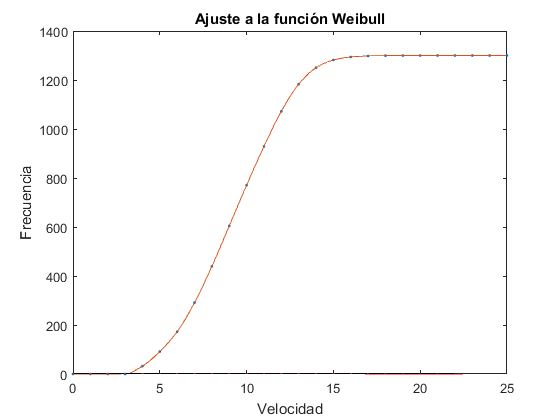
x=0.5:1:max(velocidad);
horas=hist(velocidad,x);
frec=horas/sum(horas);
f=@(a,x) (a(1)/a(2))*((x/a(2)).^(a(1)-1)).*exp(-(x/a(2)).^a(1));
a0=[2 8];
af=nlinfit(x,frec,f,a0);
hold on
bar(x,frec,'c');
x=linspace(0,max(velocidad),100);
y=f(af,x);
plot(x,y,'r')
title('Ajuste a la función Weibull')
xlabel('Velocidad')
ylabel('Frecuencia')
hold off
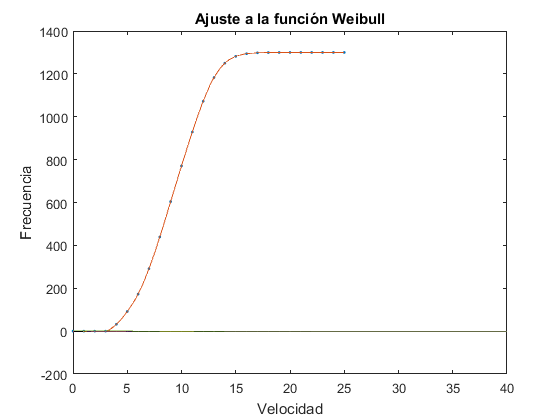
velocidad=xlsread('sotaventogaliciaanual.xlsx');
if any(isnan(velocidad))
x=1:length(velocidad);
i=find(~isnan(velocidad));
velocidad=interp1(x(i),velocidad(i),x);
end
x=0.5:1:max(velocidad);
horas=hist(velocidad,x);
frec=horas/sum(horas);
f=@(a,x) (a(1)/a(2))*((x/a(2)).^(a(1)-1)).*exp(-(x/a(2)).^a(1));
a0=[2 8];
af=nlinfit(x,frec,f,a0);
hold on
bar(x,frec,'c');
x=linspace(0,max(velocidad),100);
pot=xlsread('sotavento_curva potencia.xlsx');
t=linspace(0,25);
pow=@(v) pchip(pot(:,1)',pot(:,2)',v);
fun_a_integrar=@(t) f(af,t).*pow(t);
p_media=quad(fun_a_integrar,0,25)
p_media =

  189.7883
Ejercicio 3
m=20;
k=20;

for c=[5,40,200]
    f =@(t,y) [y(2); (-c*y(2)-k*y(1))/m];
    [t, yy] = ode45(f, [0 40], [1 0]);
    plot(t, yy(:,1))
    hold on
end
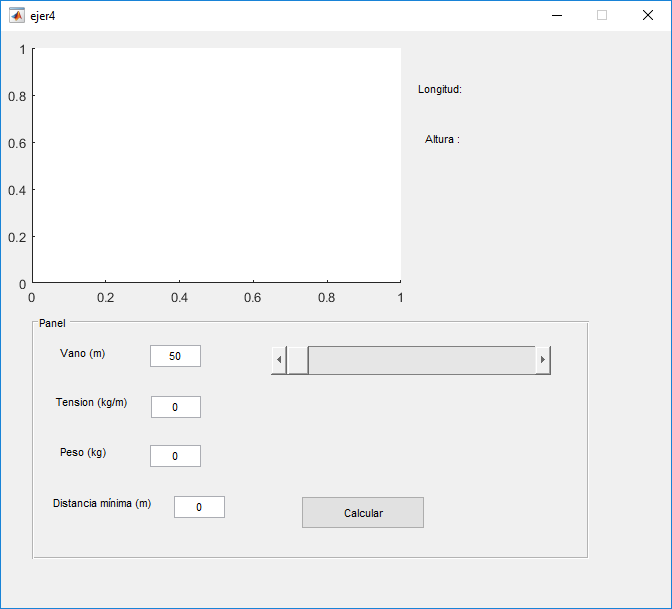
Ejercicio 4